Let’s raise the temperature
In this tutorial we will learn how to introduce lattice vibrations in the calculation. Indeed, vibrational damping can greatly change the result of a calculation since it adds incoherence that will damp the modulations of the signal.
This was experimentally shown back to 1986 for example by R. Trehan and S. Fadley (see reference below). In their work, they performed azimutal scans of a copper(001) surface at 2 different polar angles: one at grazing incidence and one at 45° for incresing temperatures from 298K to roughly 1000K.
For each azimutal scan, they looked at the anisotropy of the signal, that is:
\(\frac{\Delta I}{I_{max}}\)
This value is representative of how clear are the modulations of the signal. As it was shown by their experiments, this anisotropy decreases when the temperature is increased due to the increased disorder in the structure coming from thermal agitation. They also showed that this variation in anisotropy is more pronounced for grazing incidence angles. This is related to the fact that surface atoms are expected to vibrate more than bulk ones. They also proposed single scattering calculations that reproduced well these results.
We propose here to reproduce this kind of calculation to introduce the parameters that control the vibrational damping.
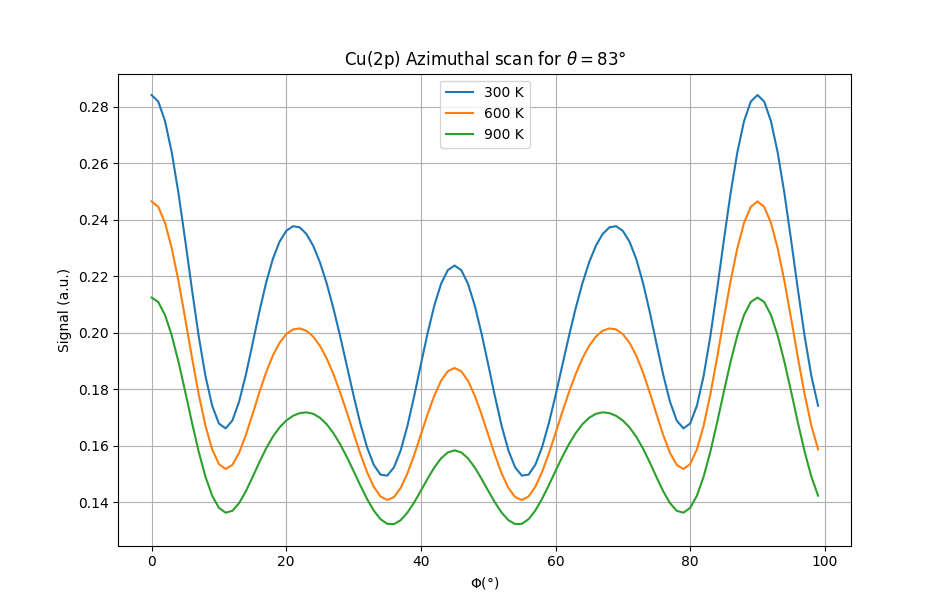
Azimutal scans for Cu(2p) at grazing incidence and at 45°.
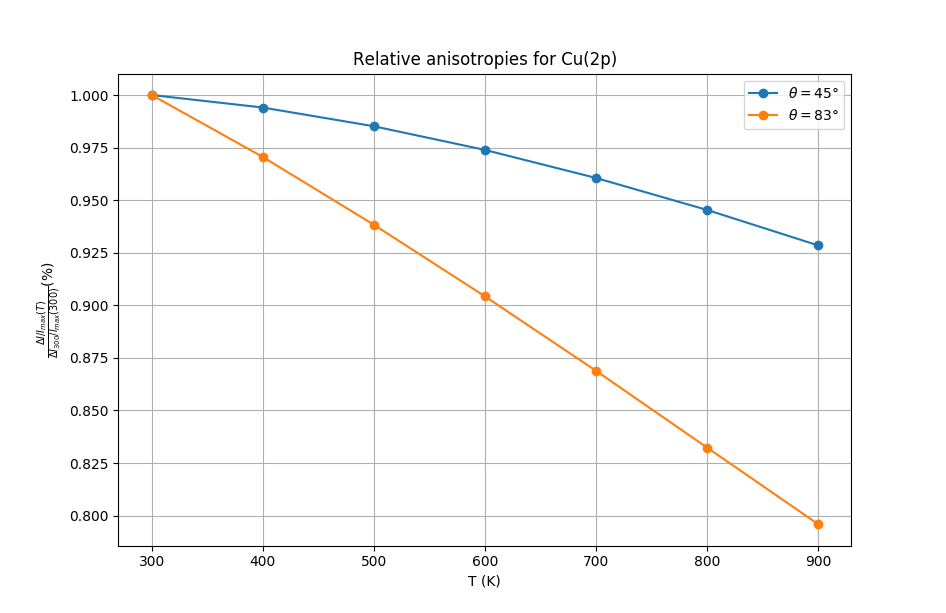
Variation of anisotropy as a function of temperature and polar angle.
  1# coding: utf8
  2
  3from ase.build import bulk
  4import numpy as np
  5from msspec.calculator import MSSPEC, XRaySource
  6from msspec.utils import hemispherical_cluster, get_atom_index
  7
  8
  9def create_clusters(nplanes=3):
 10    copper  = bulk('Cu', a=3.6, cubic=True)
 11    clusters = []
 12    for emitter_plane in range(nplanes):
 13        cluster = hemispherical_cluster(copper,
 14                                        emitter_plane=emitter_plane,
 15                                        planes=emitter_plane+2,
 16                                        shape='cylindrical')
 17        cluster.absorber = get_atom_index(cluster, 0, 0, 0)
 18        cluster.info.update({
 19            'emitter_plane': emitter_plane,
 20        })
 21        clusters.append(cluster)
 22    return clusters
 23
 24def compute(clusters, all_theta=[45., 83.],
 25            all_T=np.arange(300., 1000., 400.)):
 26    data = None
 27    for ic, cluster in enumerate(clusters):
 28        # Retrieve info from cluster object
 29        plane   = cluster.info['emitter_plane']
 30
 31        calc = MSSPEC(spectroscopy='PED', algorithm='expansion')
 32        calc.source_parameters.energy = XRaySource.AL_KALPHA
 33        calc.muffintin_parameters.interstitial_potential = 14.1
 34
 35        calc.calculation_parameters.vibrational_damping = 'averaged_tl'
 36        calc.calculation_parameters.use_debye_model = True
 37        calc.calculation_parameters.debye_temperature = 343
 38        calc.calculation_parameters.vibration_scaling = 1.2
 39
 40        calc.detector_parameters.average_sampling = 'high'
 41        calc.detector_parameters.angular_acceptance = 5.7
 42
 43        for atom in cluster:
 44            atom.set('forward_angle', 30)
 45            atom.set('backward_angle', 30)
 46        filters = ['forward_scattering', 'backward_scattering']
 47        calc.calculation_parameters.path_filtering = filters
 48
 49        calc.calculation_parameters.RA_cutoff = 2
 50
 51        for T in all_T:
 52            for theta in all_theta:
 53                calc.calculation_parameters.temperature = T
 54                calc.calculation_parameters.scattering_order = min(1 + plane, 3)
 55                calc.set_atoms(cluster)
 56                data = calc.get_phi_scan(level='2p3/2', theta=theta,
 57                                         phi=np.linspace(0, 100),
 58                                         kinetic_energy=560, data=data)
 59                dset = data[-1]
 60                dset.title = "plane #{:d}, T={:f}K, theta={:f}°".format(plane,
 61                                                                        T,
 62                                                                        theta)
 63
 64                dset.add_parameter(group='misc', name='plane', value=plane, unit='')
 65                dset.add_parameter(group='misc', name='T', value=T, unit='')
 66                dset.add_parameter(group='misc', name='theta', value=theta, unit='')
 67    return data
 68
 69
 70def analysis(data):
 71    all_plane = []
 72    all_T     = []
 73    all_theta = []
 74    for dset in data:
 75        plane = dset.get_parameter('misc', 'plane')['value']
 76        T     = dset.get_parameter('misc', 'T')['value']
 77        theta = dset.get_parameter('misc', 'theta')['value']
 78        cs    = dset.cross_section.copy()
 79        phi   = dset.phi.copy()
 80
 81        if plane not in all_plane: all_plane.append(plane)
 82        if T not in all_T: all_T.append(T)
 83        if theta not in all_theta: all_theta.append(theta)
 84
 85    def get_anisotropy(theta, T):
 86        cs = None
 87        for dset in data:
 88            try:
 89                _T     = dset.get_parameter('misc', 'T')['value']
 90                _theta = dset.get_parameter('misc', 'theta')['value']
 91                _cs    = dset.cross_section.copy()
 92                phi    = dset.phi.copy()
 93            except:
 94                continue
 95            if _theta == theta and _T == T:
 96                try:
 97                    cs += _cs
 98                except:
 99                    cs = _cs
100        Imax = np.max(cs)
101        Imin = np.min(cs)
102        return (Imax - Imin)/Imax
103
104    # create a substrate dataset for each T and theta
105    anisotropy_dset = data.add_dset("all")
106    anisotropy_view = anisotropy_dset.add_view('Anisotropies',
107                         title='Relative anisotropies for Cu(2p)',
108                         marker='o',
109                         xlabel='T (K)',
110                         ylabel=r'$\frac{\Delta I / I_{max}(T)}{\Delta I_{300}'
111                                r'/ I_{max}(300)} (\%)$')
112
113    for theta in all_theta:
114        for T in all_T:
115            A  = get_anisotropy(theta, T)
116            A0 = get_anisotropy(theta, np.min(all_T))
117
118            anisotropy_dset.add_row(temperature=T, theta=theta, anisotropy=A/A0)
119
120        anisotropy_view.select('temperature', 'anisotropy',
121                               where='theta == {:f}'.format(theta),
122                               legend=r'$\theta = {:.0f} \degree$'.format(theta))
123    return data
124
125
126clusters = create_clusters()
127data     = compute(clusters)
128data     = analysis(data)
129data.view()
Here is the full script used to generate those data (download)
See also
- Temperature dependence x-ray photoelectron diffraction from copper: Surface and bulk effects
R. Trehan & C. S. Fadley, Phys. Rev. B 34 (10) p1654 (1986) [doi]