Computing a substrate XPD signal: the AlN polarity example
In this tutorial, we will see how to compute the full XPD signal of a substrate. In a photoelectron diffraction experiment, the collected electrons come from a lot of emitters that are located in different planes of the structure at different depths.
Simply put, getting the total signal from a substrate from a given type of emitter is computing the signal for the emitter at the surface, at the subsurface, in the 3rd plane… etc, and summing all together.
This task can be tedious since it requires to create as many clusters as needed by the number of planes to compute. Clusters may be different from one to another because you do not need all the planes if the emitter is at the surface for example and also because the emitter has to be located at the center of the surface to preserve as much as possible the symmetry.
A function called hemispherical_cluster() is very handy for that purpose. Before diving into a the more
realistic example of aluminium nitride, you may read more about how to use this function in the FAQ section
The hemispherical_cluster function.
In a work published in 1999, Lebedev et al. demonstrated that Photoelectron diffraction can be used as a non invasive tool to unambiguously state the polarity of an AlN surface. Aluminium nitride cristallizes in an hexagonal cell and the authors experimentally showed that the polarity of the surface can be controlled by the annealing temperature during the growth. Both polarities are sketched in the figure 1 below.
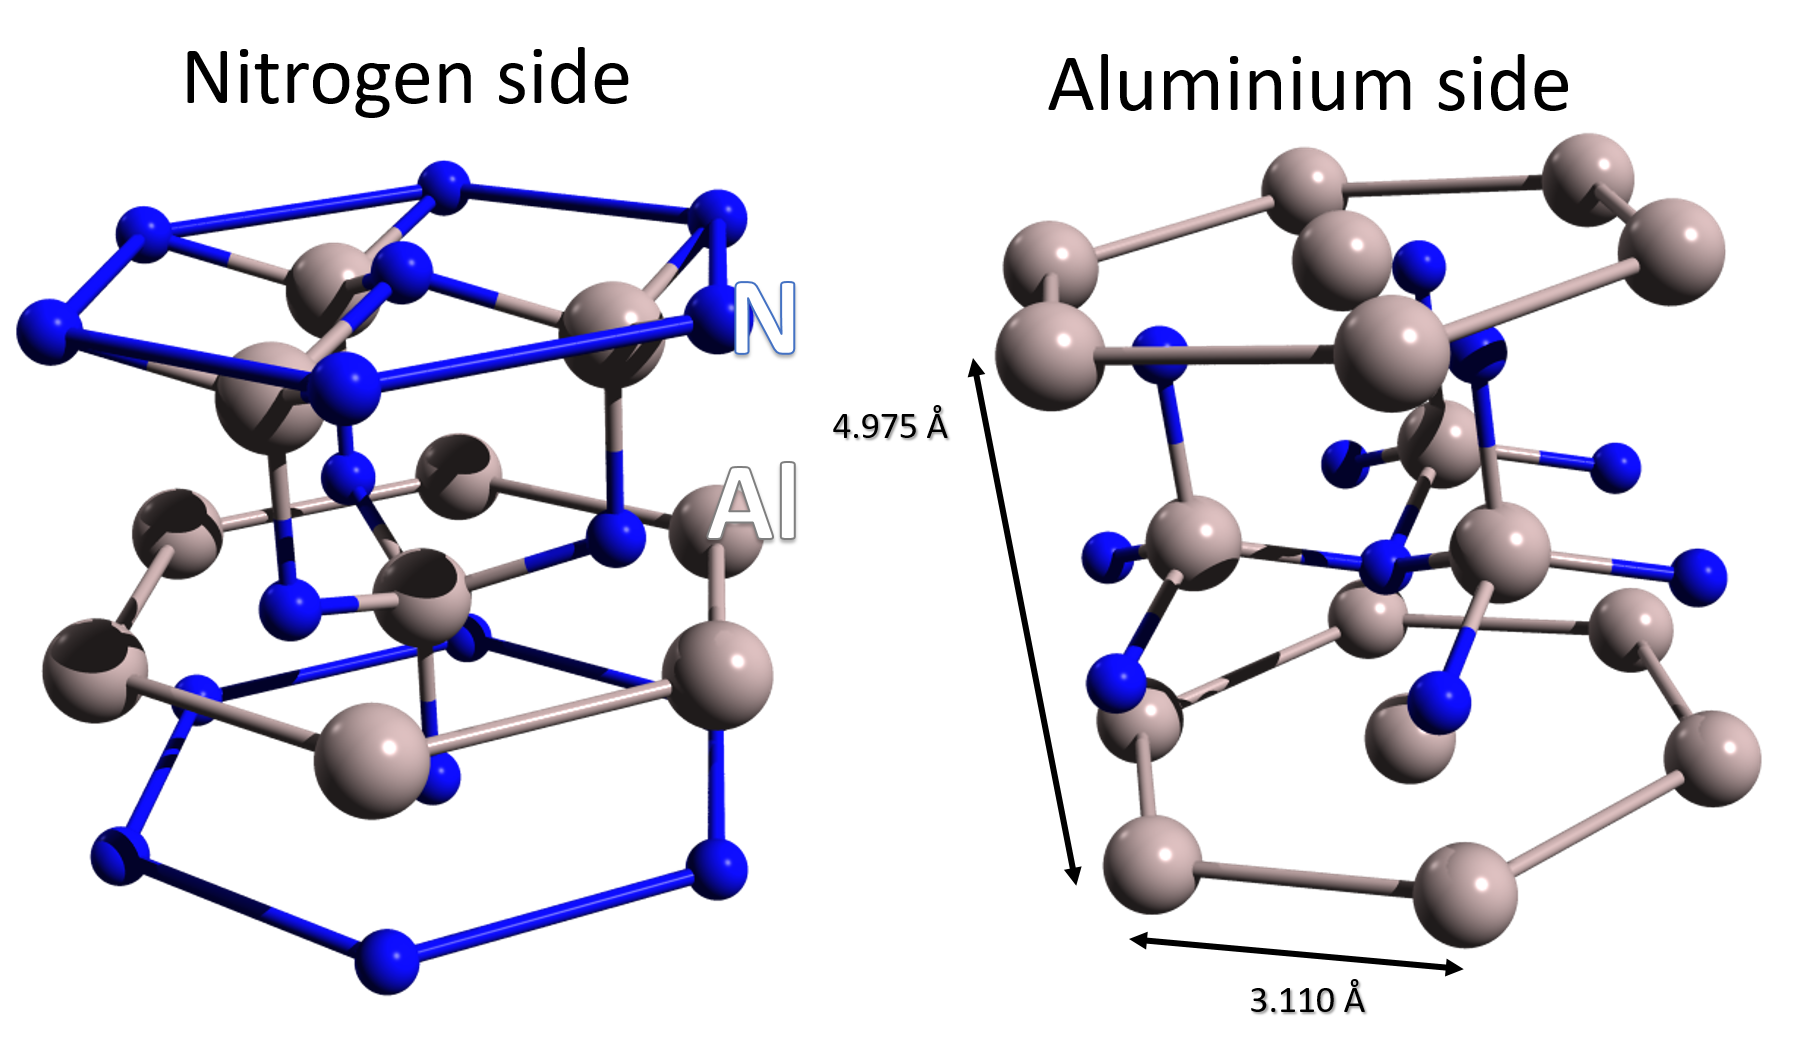
Figure 1. AlN hexagonal lattice in the left) N polarity with nitrogen terminated surface and AlN4 tetrahedrons pointing downward and right) Al polarity with aluminium terminated surface and AlN4
In this work, the authors studied the Al(2p) and N(1s) diffraction patterns for both polarities and they demonstrated that the Al(2p)/N(1s) ratio exhibits 2 clear peaks at 32° and 59° polar angle in the (10-10) azimuthal plane only for the aluminium side.
We will attempt to reproduce these results in the multiple scattering approach. In the AlN cell there are 2 Al atoms and 2 Nitrogen atoms that are non equivalent. To compute the polar scan of a bulk AlN with those 2 variants, we need to create one cluster for each non equivalent emitter in each plane. We chose to work with 8 planes, so we have to compute the polar scan for 32 AlN clusters. The total signal for a polar scan will be the sum of all the scans with the same kind of emitter in each plane.
The code is splitted in different functions. The function AlN_cluster() allows to create an AlN cluster
through the use of the hemispherical_cluster() function by specifing the surface termination and the
direction of the AlN4 tetrahedrons. This function is used by the second function called create_clusters()
which returns a list of clusters to use for the calculation of a substrate with the desired polarity and emitter
chemical symbol. The function compute_polar_scans() does the calculation of a polar scan for a list of
clusters and save all results in a file called all_polar_scans.hdf5. Finally, the analysis() function performs
the sum of all the data and add a new dataset with the 3 figures reported in figures 2 and 3 below.
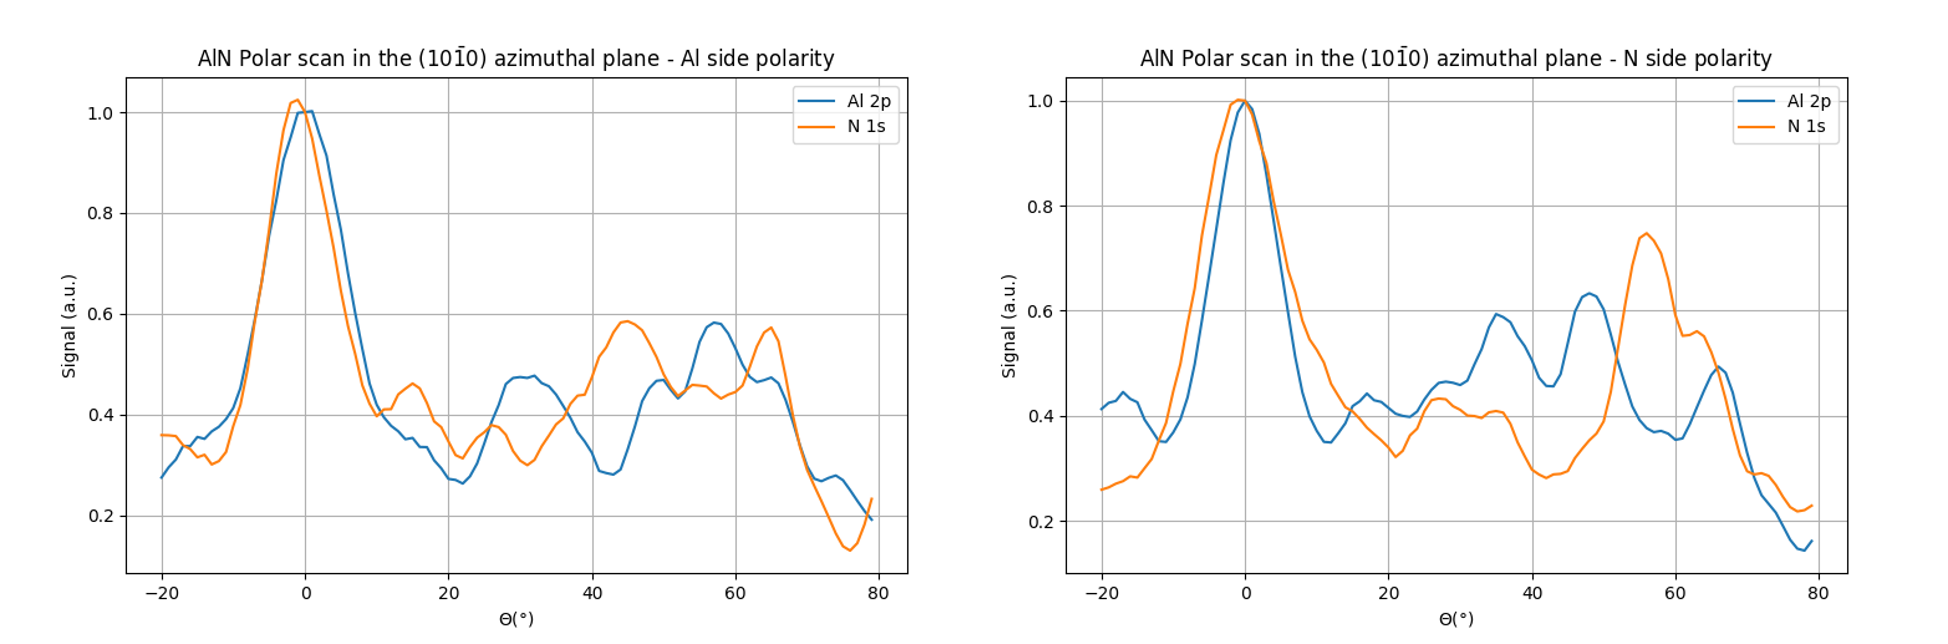
Figure 2. Polar scans in the (10-10) azimuthal plane of AlN for Al polarity (left) and N polarity (right).
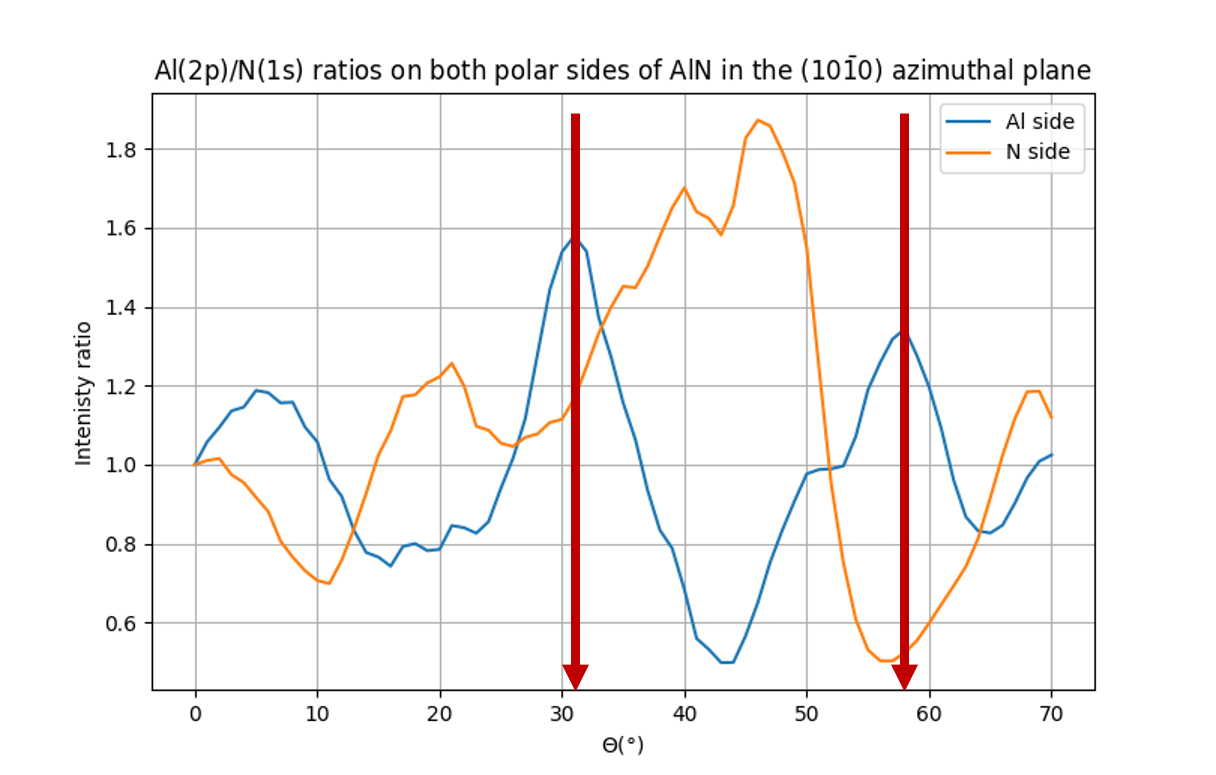
Figure 3. Al(2p)/N(1s) intensity ratio for both polarities.
As can be seen in figure 3, the peaks at 32° and 58.5° are well reproduced by the calculation for an Al polarity. Some discreapancies arise between the experimental work and this simulation especially for large polar angles. This may be due to the use of a too small cluster in diameter for the deeper emitters.
The full code of this tutorial can be downloaded here
See also
- The polarity of AlN films grown on Si(111)
V. Lebedev, B. Schröter, G. Kipshidze & W Richter, J. Cryst. Growth 207 p266 (1999) [doi]